Watching your systems in realtime
What tools are available and how do they work?
|
|
Watching your systems in realtimeWhat tools are available and how do they work?
|
There are several benefits to having a realtime monitoring system for your computer and networking equipment. Namely, such a system allows you to easily identify short-term problems, understand the usage patterns of your systems, and record the data for long-term capacity planning. This article discusses the issues, challenges, requirements, and steps required to install your own realtime monitoring system. (2,000 words)
|
Mail this article to a friend |
![]() he long-term issue of capacity planning has become increasingly
crucial as computer networks are constantly being pushed to their
limits. There are also the short-term issues related to problem
identification and resolution. Typically, both capacity planning
and problem identification are based on the same set of data. For
example, in heavily used Web servers, Sun systems can drop packets
inside the kernel (the
he long-term issue of capacity planning has become increasingly
crucial as computer networks are constantly being pushed to their
limits. There are also the short-term issues related to problem
identification and resolution. Typically, both capacity planning
and problem identification are based on the same set of data. For
example, in heavily used Web servers, Sun systems can drop packets
inside the kernel (the nocanput parameter from netstat -k output).
In the short term, identification of this problem is clearly
important in the performance of your Web server. The long-term
trend of the number of packets dropped per second may indicate that
more servers are needed.
While there are many short-term monitoring tools, such as perfmeter
and top, which can be used to monitor systems on a second-by-second
basis, this article will focus on tools that monitor systems on both a
short- and long-term basis, which narrows the field considerably.
Designing a realtime monitoring system presents several challenges. The first one is managing large amounts of data; the data may be stored for long periods of time, ranging from many months to a year, for long-term capacity planning. A second challenge is determining how to make the data easily viewable.
When I designed a realtime monitoring system for GeoCities, the system had to be able to do the following:
The best realtime monitoring solutions are those that allow easy customization of visualization options (and the type of data to record, etc.) because each site has its own requirements and problems. Having access to the source code always helps in these matters, as does designing for flexibility.
Orca, RRD, and SE toolkit solution
For SPARC or x86 Solaris-based monitoring, a freely available
solution that meets the above requirements is a collection of tools
that include the following:
percollator.se script called orcallator.se for collecting system data
orcallator.se, creates an HTML tree, and uses RRD to generate GIF plots
Orca requires the installation of the SE toolkit and the orcallator.se
program on each monitored system. The SE toolkit contains a program
se that, like Perl or the Bourne shell, reads and executes scripts
written in a C-like language. SE's unique feature is its easy access
to kernel datastructures. This makes it popular for measuring,
processing, and reporting such data.
orcallator.se is a program written in the SE language and is a heavily
modified version of the original SE percollator.se program. Its
improvements include the recording of many more system parameters. In
fact, almost any measurement made in the SE examples/zoom.se script is
recorded by orcallator.se. It also allows users to easily choose
which portions of the system are to be measured. orcallator.se is
designed so that it can measure each of the following subsystems: CPU,
mutex contention, network interface cards, TCP stack, NFS, disk IO
usage, the directory name lookup cache (DNLC), inode cache, RAM, and page
usage. Additionally, orcallator.se can process NCSA and
Squid-style logs to generate statistics related to the amount of traffic
the Web server receives, such as hit rate, bytes sent per second, etc.
orcallator.se appends its measurements in a single line to a text file
every five minutes for later processing and viewing. For a proper
Orca installation, all hosts being monitored should mount a common NFS
shared directory and write orcallator.se's output there. For a good
description of how orcallator.se and its predecessor, percollator.se,
work, see Adrian Cockcroft's past
Performance Q&A column (SunWorld, March 1996).
Orca makes use of a library, written by Tobias Oetiker, that provides a round-robin database. For users of Multi Router Traffic Grapher, RRD will prove familiar. RRD provides a flexible binary format for the storage of numerical data measured over time.
An arbitrary number of different datastreams are pushed into an RRD file and passed through an arbitrary number of consolidation functions and then permanently stored. So a single-input datastream may result in several different consolidated streams inside the RRD file. Consolidation is a feature in which an arbitrary number of measured data points are consolidated into a single data point. Available consolidation methods are the minimum, maximum, and average functions. For example, six data points measured five minutes apart may be consolidated into a single 30-minute data point using either the average, minimum, or maximum of the six data points. The 30-minute consolidated data points may be used when plotting data over the longer term, such as monthly data, but a separate consolidated stream consisting of one input data point may be used in plotting a day-long view of the data.
Consolidation of input data provides long-term data storage in a reduced amount of disk space. The consolidated data is used when Orca plots longer term data, like yearly plots of data. This feature provides one of the key advantages of RRD: the binary data files do not grow over time. Upon creation of an RRD data file, the user specifies how long a particular data point in a consolidated datastream will remain in the file. In Orca's case, five-minute data is kept for 200 hours; 30-minute averaged data is kept for 31 days; two-hour averaged data is kept for 100 days; and daily averaged data is kept for three years. Such a data file is 50 KB long. RRD reads an arbitrary number of RRD files and generates GIF plots.
Orca is a Perl script that reads a configuration file and indicates
where its input text data files are located, the general format of the
input data files, where its RRD data files should be located, and the
root of the HTML tree to generate. The HTML tree contains a root
document in index.html listing each host and each
measurement made. Clicking on a link takes the viewer to a page
showing actual plots. Plots will either show a daily, weekly,
monthly, or yearly view of the data in question. Orca allows easy
comparison of the same measurement on different systems by listing all
the same measurements on a single Web page.
In its normal mode Orca runs continuously, sleeping until new data is
placed by orcallator.se into the output data files. Once new data is
written to a file by orcallator.se, Orca updates the RRD data files,
and any GIFs that need to be updated are recreated.
Orca offers the following advantages:
orcallator.se runs as a single process on each monitored system and does not fork off any processes; hence it puts a minimal load on the system
The only disadvantage to this solution is that the data collection
portion, orcallator.se and the SE toolkit, is only available on SPARC
and x86 Solaris platforms. Because Orca and RRD are platform-independent,
they can be used on any system, but a new data collection
tool would have to be designed.
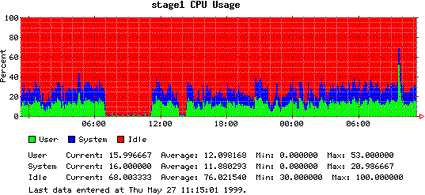
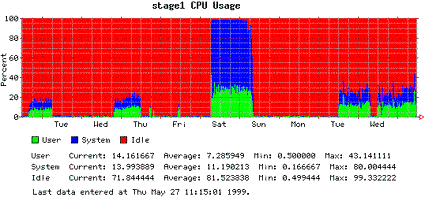
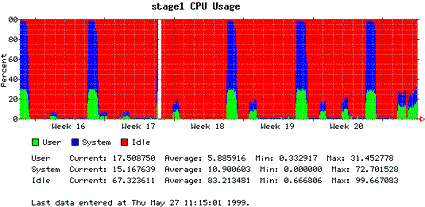
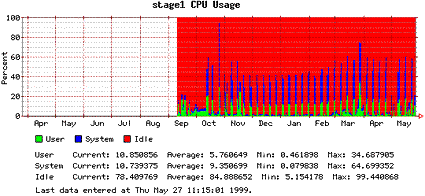
As an example of the output generated by Orca, these four plots show the daily, weekly, monthly, and yearly CPU utilization of one of our servers. Here, green represents the percentage of CPU time spent executing user code; blue represents the percentage of CPU time executing system code; and red represents the percentage of idle CPU time.

Figure 1. Daily plot |

Figure 2. Weekly plot |

Figure 3. Monthly plot |

Figure 4. Yearly plot |
A more complete example showing the comparison capabilities of Orca is located at http://www.geocities.com/~bzking/orca-example/.
|
|
|
|
|
Designing your own monitoring system: The basics
If the above solution isn't applicable to your environment, a
custom realtime monitoring system must be designed. The first step
in designing your system is determining the scope and requirements of
the project. Answer the following questions:
A realtime monitoring system involves several components. The first
is the data collection tools. These may be programs that come with
the operating system such as sar or netstat, freely available programs
such as top or the SE toolkit, or commercial programs. The second is
a data storage system. This may be as simple as using flat text files
with each measurement on a separate line or as complicated as a full-fledged
database. The data collection tools must be able to derive information efficiently from the data storage system.
The next step is determining what tool will gather and collate the input data into groupings that make sense for presentation. What language will this be written in? This program must be able to interface with the data storage system as well as another key component, the data visualization tools. Finally, how will your data be visualized? Do you want to view it in a Web browser or something more powerful, such as a Java program that allows arbitrary groupings of data? Do you want a CGI script to create the graphs, or have the graphs continuously updated? Personally, I dislike waiting for a CGI to generate an HTML page and the graph GIFs. It reduces the tendency for people to examine the data to see what may be wrong with the system and makes ad-hoc analysis more time consuming.
Before writing any code, see what tools and packages you can leverage to reduce the creation time of your system. My mantra is: Don't reinvent the wheel, but feel free to improve it. I've always found that other authors are happy to accept additions and improvements to their code.
There are some things to watch out for in designing your own realtime
monitoring system. The first is scalability as the number of
monitored systems increases. What happens to the system as the number
of hosts increases from 10 to 100? The initial Orca worked well with
10 hosts, but internal datastructures ballooned when monitoring 100
hosts. The system should also be fast because it is, after all,
a realtime monitoring system. If the two previous issues aren't that important,
then the following one should be: the measuring tools should be as lightweight as possible
on a running system. Ideally, create a tool that does not fork off
any processes and does not need to be invoked via cron. Any tool that
spawns other processes will affect the measurements it is making. If
you have a Bourne or C shell script that forks many processes to make
measurements or process output from other programs, consider rewriting
the code in Perl or SE to reduce the number of additional
processes on the system.
![]()
|
|
Resources
About the author
![]() Blair Zajac is an IT analyst at Yahoo!/GeoCities where he focuses on
Web site architecture and performance issues, including networking
hardware, content storage, international distribution, server
operating systems, and Web server software. He is the author of the
Orca system monitoring system and was a key developer of the freely
available Amanda backup software system. Before moving to Yahoo!/GeoCities,
he was the systems manager for the Geological and Planetary Sciences
Division at Caltech, where he also received a PhD in geophysics.
Blair Zajac is an IT analyst at Yahoo!/GeoCities where he focuses on
Web site architecture and performance issues, including networking
hardware, content storage, international distribution, server
operating systems, and Web server software. He is the author of the
Orca system monitoring system and was a key developer of the freely
available Amanda backup software system. Before moving to Yahoo!/GeoCities,
he was the systems manager for the Geological and Planetary Sciences
Division at Caltech, where he also received a PhD in geophysics.
If you have technical problems with this magazine, contact webmaster@sunworld.com
URL: http://www.sunworld.com/swol-07-1999/swol-07-realtime.html
Last modified: