|
|
Analysis of TCP transfer characteristics for Web servers made easierSecret weapon now available as a free download! We tell you how a tool for visualizing TCP transfer sequences can pinpoint problems that might go unnoticed in a snoop listing or packet analyzer |
TCP transfers can be classified into a number of characteristic sequences that can be recognized to determine problems. A tool for visualizing the sequences makes this a lot easier to do. Examples of some common sequences seen on Web servers illustrate the characteristics. (2,500 words)
|
Mail this article to a friend |
Q: How can I figure out what's really happening to TCP/IP so I can tell what needs to be tuned on my Web server?
A: I've been using a really cool tool as my secret weapon for some time, now it is available as a free download, and I'll illustrate how it can be used to see things that you can't figure out from a snoop listing or packet analyzer.
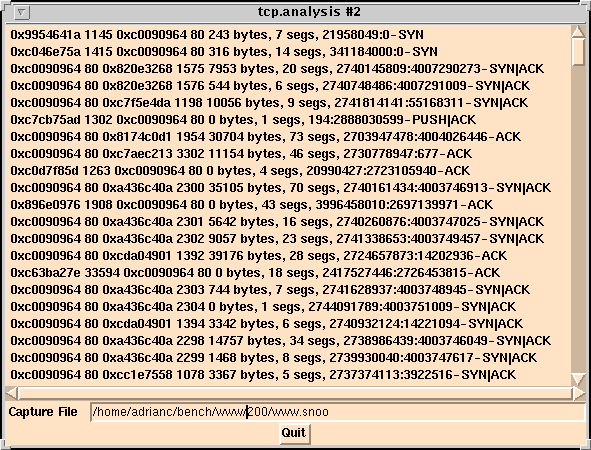
Steve Parker created this tool a year or two ago and has recently made it available for download over the Internet. The basic tool is a language called the packet shell (psh) which understands protocols like TCP/IP over Ethernet. Coupled with the Tcl/Tk toolkit and a simple X-based plotting utility a GUI-based tool can be constructed. The tool provided is called tcp.analysis. It reads a snoop file, sorts the packets into TCP sequences, and lets you pick one to graph.
A screenshot is shown below. The data shown on each line starts with the source IP address and port number, then the destination IP address and port number. The total number of bytes in the sequence and the number of segments (Ethernet packets) is followed by the TCP sequence numbers and any flags seen in the sequence. If there is a SYN, then you have captured the start of a sequence in the snoop file.
|
|
|
|
|
Collecting a snoop sequence
You must have superuser permissions to run snoop. You should also be
careful about the security of traffic on your network -- and don't
provide read permission for others on collected snoop files. You can
cut down the size of a snoop file by truncating saved packets to 128
bytes. This captures most higher-level protocol headers (like HTTP
and NFS). If you just want the TCP header truncate to 54 bytes. The
tcp.analysis tool slows down if there are too many packets in the
file. I would suggest 1000 packets on a lightly loaded network, and
no more than 10000 on a busy one. If possible collect using a
separate system, which has no traffic of its own to get in the way
and no other jobs running to steal CPU time. If you have to, it is
all right to collect on an active server as long as there is some
spare CPU time. If the collecting system is too busy, you may drop
some packets.
You must also avoid generating more packets with snoop. Don't write the output file over NFS or run snoop from an rlogin session over the same network without redirecting the stderr output to /dev/null. I always write the output to /tmp, as it is memory based. You can either monitor every packet that goes by, or use snoop's filtering capabilities to look for a particular host or protocol. While it is running, snoop counts out the packets to stderr.
# snoop -s 128 -c 1000 -o /tmp/test.snoop
Using device /dev/le (promiscuous mode)
1000
#
I collected some snoop data on Web servers, both on the Internet and on a local high-speed connection. I sat down with Steve Parker and Bruce Curtis of SunSoft's Internet Engineering Group, and we looked through the data. I wanted to see if the data was random or could be characterized into common sequences. We found about 10 different looking plots overall, and gave up after everything else we looked at matched one of the categories. The results are shown below.
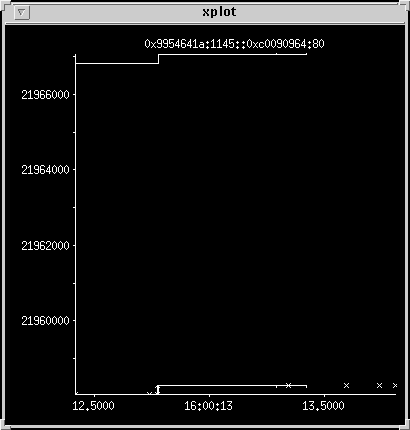
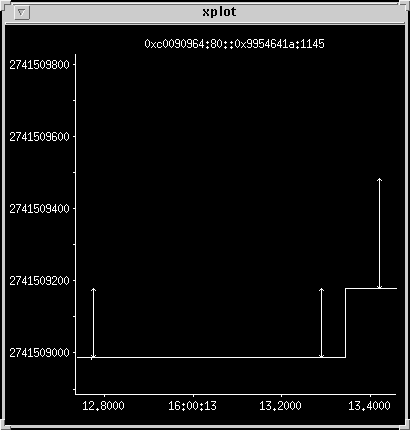
Tiny HTTP transfer -- HTTP GET incoming request and acks
This trace shows the sequence number up the side, and time along the
X axis. The upper line is the advertised receive window; the lower
line is the acknowledged data. In this case they are eight kilobytes
apart which is the default for Solaris 2. This trace shows the
Solaris server receiving on port 80 and a remote client sending on
port 1145. The server gets a 243-byte incoming GET request marked
by a vertical bar with arrows at each end. It then gets acks for the
data it is sending, which is shown in another graph. The request is
acked immediately, and the received data line and the advertised
window both step up at that point.
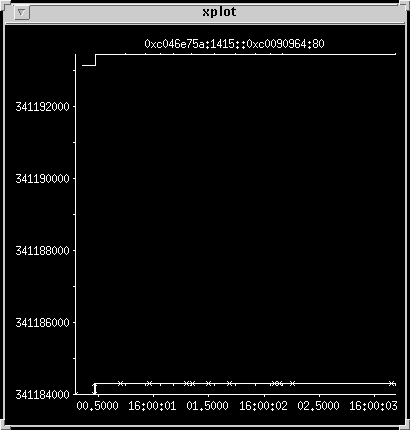
HTTP GET outgoing response
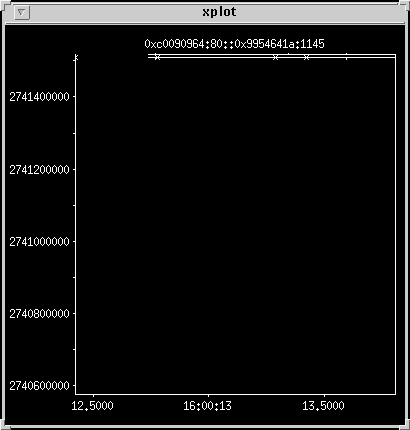
This is the reverse direction on ports 1145 and 80, the last packet
sent had a zero sequence number so the plot is bunched up to the top.
Zoom in
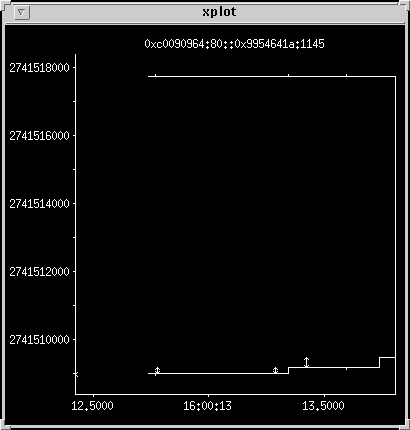
Use the left mouse button to zoom in by rubber banding the parallel
lines at the top until they fill the view. The upper line is the
HTTP client's receive window and the lower line shows what the
client has acked. The vertical bars show three packets. If you mess
up the zooming in you can zoom back out by clicking the left mouse
button outside the drawing area (i.e. by the axes labels).
Zoom in on the packets
You can see that the first packet is 200 bytes or so. This is the
HTTP header being returned. It occurs twice with the same sequence
number about 500 milliseconds (ms) apart as it is retransmitted. The
second packet is about 300 bytes of data. It is sent after the first
packet has been acked and you can see the received data window step
up at that point. When you finish with the graph, click the right
mouse button to kill it.
Medium sized HTTP transfer with retransmit congestion
This connection is typical of the kind of transfer that occurs in
the presence of retransmit bugs and the 200 ms minimum retransmit
timer default. The bugs are present in the original release of
Solaris 2.5.1, but were fixed by patches last summer and backported
to older releases.
First the request
This is boring. It just shows more acks than last time.
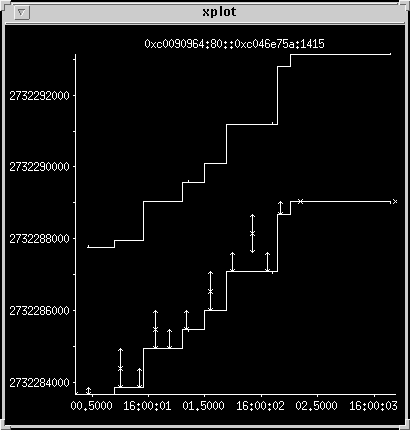
Now the response
Almost everything gets retransmitted twice. The server first sends a
short header packet. That gets there OK, so next time it sends two
packets back to back. It doesn't get an ack in time so it resends
the first of the two -- just after that the ack for the pair comes
in. It sends two more back-to-back packets, retransmits the first
one, then gets an ack for the first one only, so it retransmits the
second one. Next attempt gets both back-to-back packets there in one
attempt. It probably hasn't processed the incoming ack before it
sends the next single packet. When it sees the ack it sends two
more, then retransmits the first one before getting an ack for all
three in one go. The last packet sent is a short one. There is a
delay at the client before the connection shutdown is acknowledged.
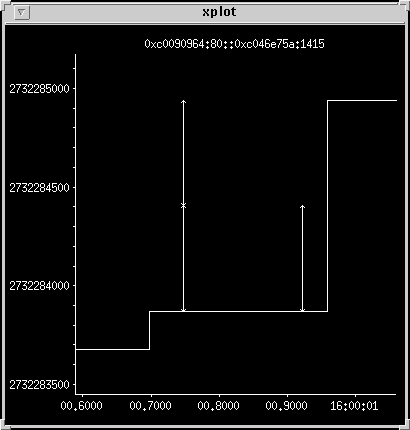
Zoom in on the first retransmit
Incoming packets are processed in preference to outgoing ones
(particularly on this system using an le driver). The ack comes in,
and there is a short delay before the pair of output packets appears
on the wire. After 200 ms the first packet is retransmitted, and it
gets to the wire a little quicker, appearing just under 200 ms after
the first one. About 40 ms later the ack for the first pair arrives.
Note that the packets are about 1500 bytes long.
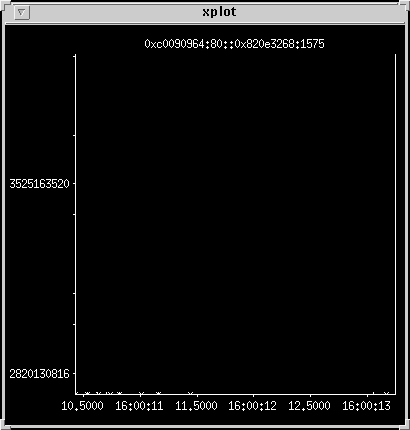
Clean transfer to buggy TCP client
This transfer goes well, but the client machine does nasty things
with the TCP window by closing it down at the end and sending a
reset packet. The reset packet contains a zero window value, which
in this case displays as higher than the sequence number, which is
over the two-gigabyte mark, and the plotting routine treats it as
negative. This compresses the axes so the data appears as ticks
along the bottom.
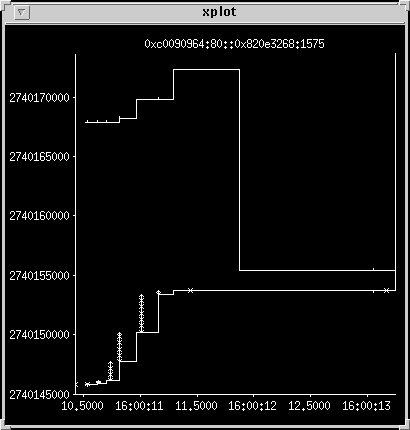
Zoom in on the X-axis until you see the data
This is what the data really looks like. The window size is about 24
kilobytes, and the packets are about 500 bytes. TCP ramps up the
transfer nicely, sending larger and larger packet clusters until it
finishes. It then waits for the client to finish processing and
acknowledge the end of the connection. The client then illegally
shrinks the TCP window it is advertising before the connection
eventually clears and it sends a reset.
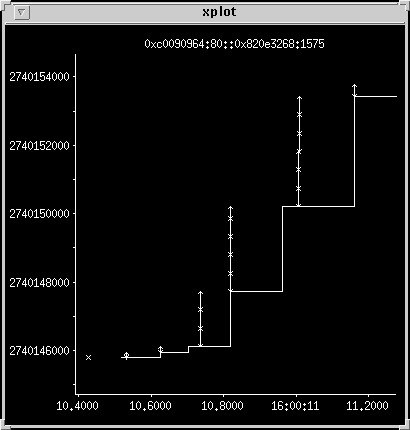
Zoom in again on the data transfer
The client is turning around acks in around 100 ms, so there are no retransmits.
Small window limited transfer
This one shows a long slow transfer where the client advertises a
three-kilobyte window, and 500-byte packets are used. You can see
that despite long delays between packets there is no retransmission.
The transfer starts off behind the window then catches up. For the
second half of the transfer -- as soon as some window opens up -- a
packet is sent. Packets at the end of the transfer seem to be
missing, although the acks must be present. I think this trace is
truncated by the 10-second snoop collection period.
Another example
This one has a two-kilobyte window, but we are trying to send
1500-byte packets, which forces the server to issue a 500-byte
packet after each 1500-byte packet, then it stops until the window
is reopened. The client system is badly misconfigured. Eight
kilobytes is really a minimum window size for a low-speed, high
latency network.
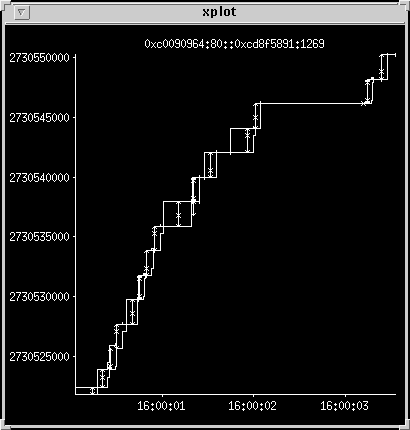
Tail end of large transfer with window close
This is a 30704-byte transfer of 73 segments, it starts before the
snoop collection period. The window size starts about 11 kilobytes,
drops to 4 kilobytes, and briefly closes completely before opening
up to 11 kilobytes again as the connection goes through another slow
start sequence and a few retransmits. The client closes the window
to zero at the end (illegal but not problematic TCP behavior).
The window closed in the middle because the client was processing the data that had been sent, but had not emptied its buffers. The window close is the mechanism used by TCP to do flow control. When you see this happen it is a sign that the client side needs to be faster or have a bigger input buffer.
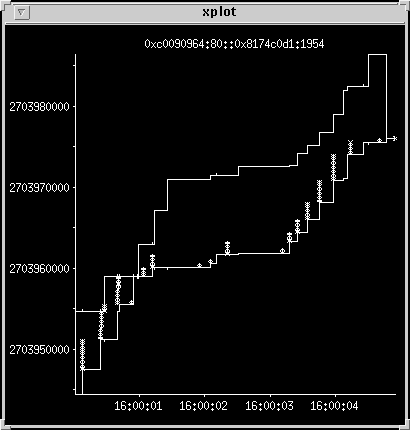
Another example
Here is another similar transfer of 35 kilobytes in 70 packets. Both
these transfers seem to have settled on a maximum transfer size of
about 500 bytes.
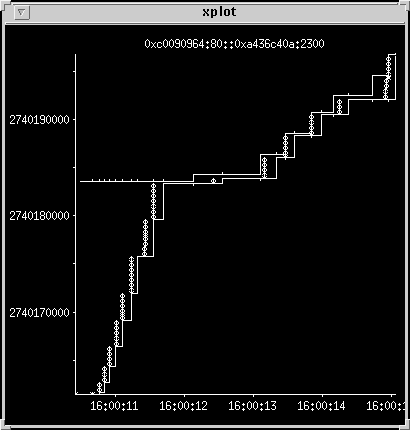
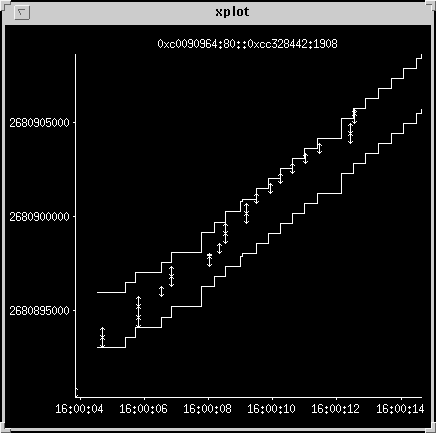
Retransmit problems
Another long sequence of packets -- 46 segments to transfer 11154
bytes. One problem is that the maximum transfer size appears to be
256 bytes, which is very inefficient, and a sign of a badly
configured router or client. It also seems to be suffering from a
lot of lost and retransmitted data. An odd effect occurs on the
server. The place to look for is just before the 16:00:05 mark,
where a packet appears below the lower line.
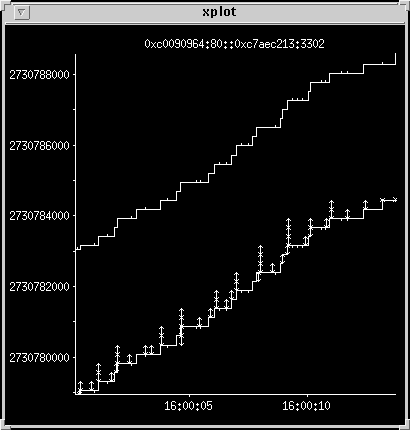
Zoom in on the offending packet
This is a case of the packet being queued for transmission, then
being delayed long enough for the ack to arrive before it is sent.
It occurs for two packets here. Other transfers, interleaved with
this one cause the delay, and the le interface tends to make this
problem worse by giving much higher priority to incoming packets.
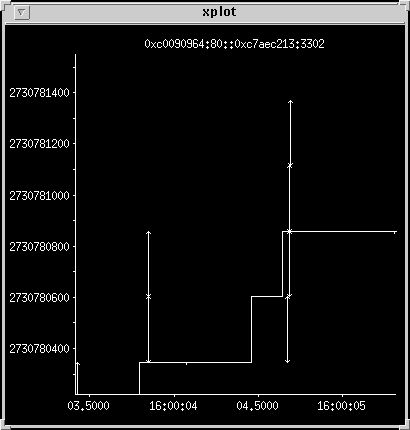
Another example
I zoomed in already on this one, as the six reset packets at the end
all blow out the y axis. It shows many retransmit attempts, probably caused
by a very lousy route for this connection.
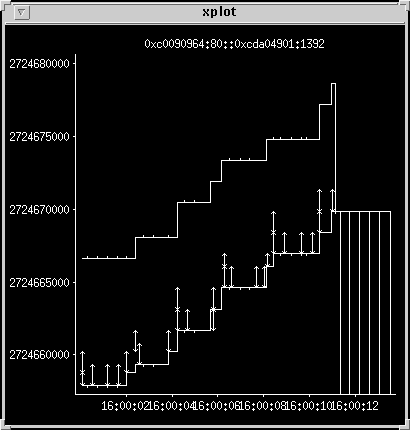
Using 1500-ms minimum retransmit timeout
A workaround for high retransmissions is to increase the minimum
retransmit timeout. This has unpleasant side effects, so make sure your
TCP patch is up to date, and don't mess with the default timeouts.
Delay caused by increased timeout
This is a normal transfer, but it drops a packet. It then stalls for
1500 ms before it retransmits the packet, showing the penalty that occurs
when the retransmit timer is increased. 1500 ms is a compromise between
too many unnecessary retransmits and long service times for lossy transfers.
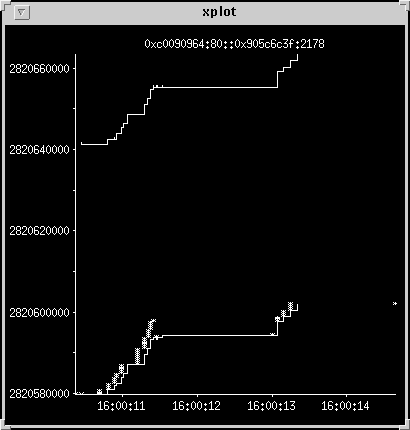
Retransmit avoided by increased timeout
The acks are returning after about 500 ms for most of the packets in
this transfer. It avoids retransmitting and becoming stuck in the congested
mode by waiting a little longer for the first packet, then continues the
transfer by sending two large packets. The tail end of this one is cut
off by the end of the snoop capture.
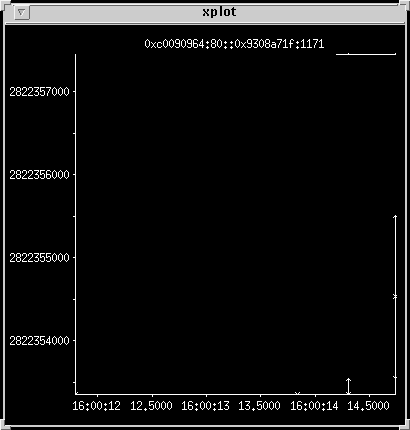
HTTP persistent connection traces
The plots have so far been based on one connection per HTTP request,
using a Netscape 1.12 server. The following plots were taken using
a Netscape 2.0 server, which supports persistent connections, part of
the HTTP 1.1 standard, also known as HTTP keepalive. In this case, after
each request, the connection is held open ready for additional requests.
Two requests
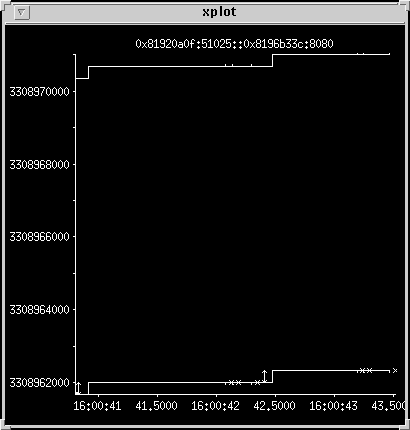
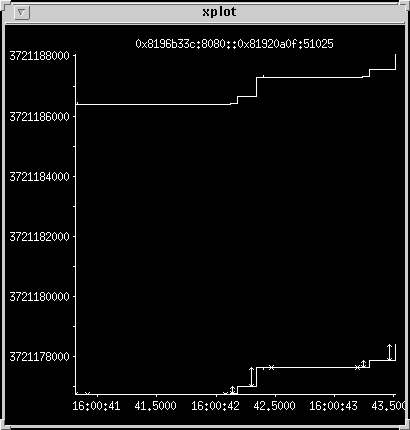
Two responses
Two small responses are shown. The header goes out followed by a single
packet.
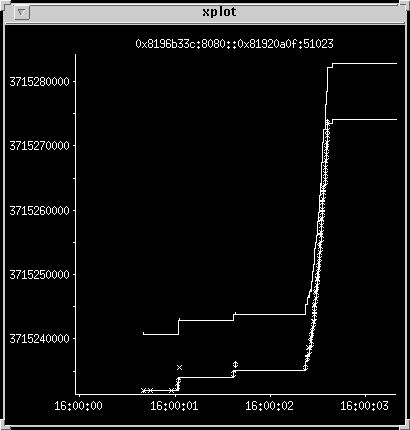
High-bandwidth transfer
This shows two small transfers followed by a large one, over
a high-speed network.
We looked at a lot more HTTP sequences, and everything we saw looked like one of the above categories. If you look at other protocols you may be able to discover problems such as inefficient block sizes or lack of pipelining. It is also clear when an increase in TCP window size is going to make a difference. In the case of a Web server, the input traffic is small, but Web clients and proxy servers can sometimes benefit from larger receive windows.
I was going to talk about proxy servers this month, but I've been
traveling a lot and didn't have time to finish working on it.
Hopefully that will be ready for next month's column. I produced
this guide to TCP for internal use a year or so ago, but now that
the tool is available externally I thought it was worth publicizing.
Thanks to Steve Parker and Chris Schmechel for creating and
maintaining the tool, and Steve and Bruce Curtis for helping me
figure out what we were looking at.
![]()
|
|
Resources
About the author
Adrian Cockcroft joined Sun Microsystems in 1988,
and currently works as a performance specialist for the Server Division
of Sun. He wrote Sun Performance and Tuning: SPARC and Solaris and Sun Performance and Tuning : Java and the Internet, both published by Sun Microsystems Press Books.
Reach Adrian at adrian.cockcroft@sunworld.com.
If you have technical problems with this magazine, contact webmaster@sunworld.com
URL: http://www.sunworld.com/swol-06-1997/swol-06-perf.html
Last modified: