|
|
How busy is the CPU, really?Unfortunately, CPU usage measurements are often inaccurate. Here's what you can do about it |
CPU usage measurements aren't as accurate as you may think. If you measure the errors directly and analyze them, it becomes clear that CPU usage is significantly under reported, especially at low usage levels. Extrapolating from low workload levels to high ones is a risky business. Adrian describes the tool he built to examine this problem and shows us plots of his results. (2,200 words)
|
Mail this article to a friend |
![]() :
In April's column you said that CPU usage is inaccurate -- but by
how much, and does it matter?
:
In April's column you said that CPU usage is inaccurate -- but by
how much, and does it matter?
![]() :
Error is minimal at high usage levels, but ranges up to 80 percent or more at low
levels. The problem is that usage is under reported, and the range of error
increases on faster CPUs.
At a real usage level of 5 percent busy, you'll often see vmstat reporting that
the system is only 1 percent busy -- under reporting by 80 percent
of the true value. You could also look at this as a 400 percent
error in the reported value.
:
Error is minimal at high usage levels, but ranges up to 80 percent or more at low
levels. The problem is that usage is under reported, and the range of error
increases on faster CPUs.
At a real usage level of 5 percent busy, you'll often see vmstat reporting that
the system is only 1 percent busy -- under reporting by 80 percent
of the true value. You could also look at this as a 400 percent
error in the reported value.
As an example of the kind of problem this can cause, consider a system planned to cope with a load of up to 1000 users. If you measure the average process activity of the first 20 users, they only appear to use 1 percent of the system (but in fact use 5 percent). There appears to be sufficient capacity for 2000 users, but really there is only enough capacity for 400. As the total user load increases, and the measurement error reduces, the amount of CPU used by each user also appears to increase.
I built a tool to measure the errors, collected data on a few systems, and plotted the results. I would like to get more data, so the tool has been folded into an updated copy of the process monitoring update bundle. If you like, you can monitor accuracy on your own systems and send me the results. I'll start with a more detailed explanation of the problem, then describe the tool I built, and show you plots of the initial results.
|
|
|
|
|
CPU usage measurements
Normally, CPU time is measured by
sampling, 100 times per second, the state of all CPUs at the clock interrupt.
Process scheduling employs the same clock interrupt used to measure CPU usage,
leading to systematic errors in the sampled data. Microstate accounting,
discussed in April's Performance Q&A, is much more accurate than sampled measurements.
To illustrate how errors occur, I'll excerpt the following example from April's column:
Consider a performance monitor that wakes up every 10 seconds, reads some data from the kernel, then prints the results and sleeps. On a fast system, the total CPU time consumed per wake-up might be a few milliseconds. On exit from the clock interrupt, the scheduler wakes up processes and kernel threads that have been sleeping. Processes that sleep consume less than their allotted CPU time-quanta and always run at the highest timeshare priority.On a lightly loaded system there is no queue for access to the CPU, so immediately after the clock interrupt, it's likely that the performance monitor will be scheduled. If it runs for less than 10 milliseconds it will have completed its task and be sleeping again by the time the next clock interrupt comes along. Now, given that CPU time is allocated based on what is running when the clock interrupt occurs, you can see that the performance monitor could be sneaking a bite of CPU time whenever the clock interrupt isn't looking.
In the diagram below, a process wakes up, then sleeps twice. The first wake-up occurs between clock ticks. The period is interrupted by the subsequent tick, which charges a full 10 milliseconds to the process. The next two wake-ups occur as a result of the clock interrupt scheduling the process. They complete before the subsequent interrupt, so there is no charge. The true measured CPU usage is measured by microstate accounting as 8.3 + 4.6 + 7.4 = 20.3 ms. The first wake-up is overestimated; the second and third are missed completely.

|
CPU usage error checking tool
I've already extended the SE toolkit to include a process class.
This reports the measured CPU usage -- but if microstate accounting is
not enabled for a process, then the value returned is just the same
as the sampled usage. I modified the process class to report sampled
CPU usage as a separate value, and to explicitly set the microstate
accounting flags to enable accurate measurement of every process and
its children.
I used the new programming interface that was introduced in Solaris 2.6; this tool doesn't work on older releases. In Solaris 2.4 to 2.5.1, microstate data is obtained by issuing an ioctl call with the PIOCUSAGE flag. This also automatically turns on microstate data collection. (This interface is still supported but will go away in a future release.) In Solaris 2.6, I obtain data by reading /proc/pid/usage, which no longer requires special permissions, but which also no longer turns on microstate data collection. The data returned is an approximation based on the sampled measurements. To turn on the flags, a control message is written to /proc/pid/ctl, which does require access permissions. To collect data for all the processes on the system, this code must be run as root.
The tool that collects data is called cpuchk.se, and is loosely based upon pea.se. It compares the sampled and measured data for each interval for each active process, then calculates the error and prints the results. It also calculates the overall CPU usage totals and the total, absolute, and maximum errors. The total error is lower, because positive and negative errors are allowed to cancel each other out. The absolute error is the sum of errors without any cancellation. The maximum is the highest absolute error seen. All errors are calculated relative to the accurately measured result. If you start with the inaccurate sampled result and try to calculate errors, they are much larger -- in some cases, infinite.
I ran cpuchk.se using several sample intervals. It doesn't seem to affect the results, so I started some long-term data collection on several machines with a 10-minute interval. This only collects long running processes, but keeps the load level from the cpuchk.se command itself to a minimum. Some sample output data is shown below. The first line shows the time of day, the number of processes, and the number of processes seen for the first time. Subsequent lines show the error for each active process. The last line shows how many processes were totaled. (System processes like sched and fsflush cannot have microstate enabled, so they are excluded.)
00:17:10 cpu time accuracy check  proc 45  new 0
pid  1435  meas  0.000  samp  0.000  err 100.00%
pid   316  meas  0.001  samp  0.000  err 100.00%
pid  1438  meas  0.000  samp  0.000  err 100.00%
pid   227  meas  0.001  samp  0.002  err  28.05%
pid   211  meas  0.011  samp  0.008  err  25.80%
pid   226  meas  0.032  samp  0.035  err   7.69%
pid   229  meas  0.018  samp  0.002  err  90.92%
pid   246  meas  0.083  samp  0.060  err  28.00%
pid   318  meas  0.000  samp  0.000  err 100.00%
pid   380  meas  0.143  samp  0.003  err  97.67%
pid  1439  meas  0.000  samp  0.000  err 100.00%
pid   357  meas  0.000  samp  0.000  err 100.00%
pid   518  meas  0.125  samp  0.000  err 100.00%
pid  7376  meas  0.041  samp  0.000  err 100.00%
pid  7377  meas  0.000  samp  0.000  err 100.00%
pid  6276  meas  0.156  samp  0.156  err   0.37%
pid  6262  meas  2.413  samp  0.002  err  99.93%
pid  9199  meas  0.221  samp  0.225  err   1.56%
pid  9200  meas  0.206  samp  0.202  err   2.20%
pid  9209  meas  2.308  samp  2.333  err   1.05%
msac   42  meas  5.763  samp  3.027  err -47.48%  abs  48.56%  max 100.00%
00:27:11 cpu time accuracy check  proc 45  new 0
pid  1435  meas  0.000  samp  0.000  err 100.00%
pid   316  meas  0.001  samp  0.000  err 100.00%
pid  1438  meas  0.000  samp  0.000  err 100.00%
pid   227  meas  0.003  samp  0.002  err  46.53%
pid   211  meas  0.010  samp  0.007  err  35.85%
pid   226  meas  0.032  samp  0.022  err  31.33%
pid   229  meas  0.015  samp  0.002  err  88.77%
pid   246  meas  0.074  samp  0.052  err  30.70%
pid   318  meas  0.002  samp  0.000  err 100.00%
pid   380  meas  0.143  samp  0.000  err 100.00%
pid  1439  meas  0.000  samp  0.000  err 100.00%
pid   357  meas  0.000  samp  0.000  err 100.00%
pid   518  meas  0.122  samp  0.000  err 100.00%
pid   379  meas  0.144  samp  0.126  err  12.00%
pid  7376  meas  0.040  samp  0.000  err 100.00%
pid  7377  meas  0.000  samp  0.000  err 100.00%
pid  6276  meas  0.155  samp  0.155  err   0.00%
pid  6262  meas  2.410  samp  0.003  err  99.86%
msac   39  meas  3.152  samp  0.368  err -88.33%  abs  88.33%  max 100.00%
Analysis and graphing results
I extracted the measured CPU time and the absolute error from the
output using awk and fed it into a statistics package (S-PLUS from
www.statsci.com). After looking at the data for individual processes
for a while, I decided to concentrate on the summaries for each
measurement interval. First I plotted both of them together in time
sequence, then I plotted error as a function of CPU usage. The
relationship is basically an inverse one, so I fitted and displayed
an inverse relationship line. The systems I monitored were a
SPARCstation 10 with dual 60-MHz CPUs, an E4000 with four 168-MHz
CPUs, an Ultra 1/170, and a Tadpole 85-MHz microSPARC laptop. Not an
ideal mix, but enough to investigate the effect of CPU speed and
workload variations.
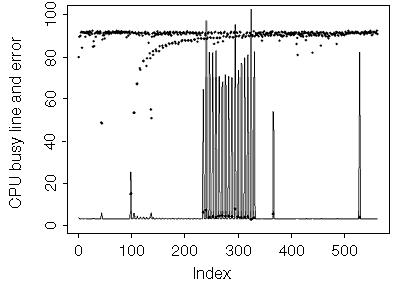
The SPARCstation 10 with dual 60-MHz CPUs is a lightly used Web server that runs CPU-intensive batch jobs from cron at regular intervals. The time-based plot shows that it is mostly idle with regular batch jobs.
|
Figure 1: Discrepancy (error) between reported CPU usage versus actual CPU usage measured over time on a SPARCstation 10 with dual 60-MHz CPUs. (CPU useage is denoted by the line, error is denoted by the dots.) |
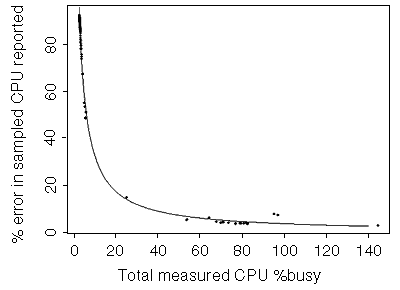
Errors show a good fit to the inverse line, probably because the workload doesn't vary much.
|
Figure 2. Discrepancy (error) in sampled CPU usage reported versus actual CPU usage measured on a SPARCStation 10. |
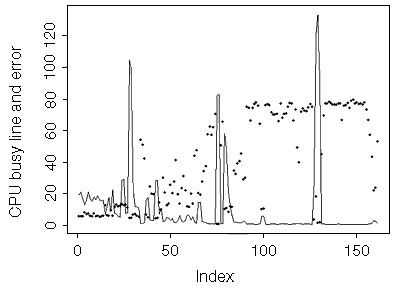
The E4000 with four 168-MHz CPUs is a workgroup server that runs e-mail and NFS services, among other things.
|
Figure 3. Time-based plot of discrepancy (error) between reported CPU usage and actual CPU usage measured on E4000 4x186MHz CPU. (CPU useage is denoted by the line, error is denoted by the dots.) |
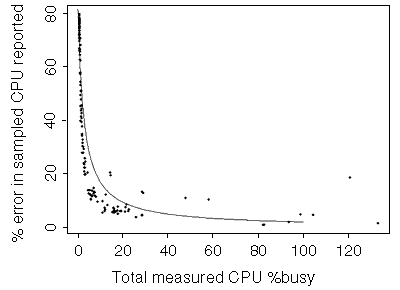
The workload mix varies, but the fit is still a reasonable one. The data falls into several distinct curves, but they are close together.
|
Figure 4. Discrepancy (error) in sampled CPU usage reported versus actual CPU usage measured on E4000 4x186MHz |
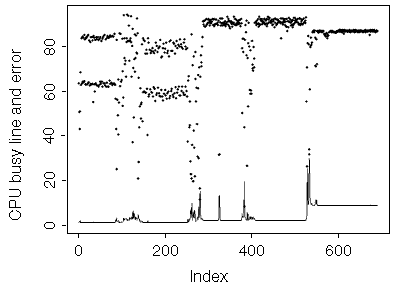
The Ultra 1/170 was running the CDE window system. It included some Web browser screens with animated GIFs and a Java application that started towards the end. The Java application ran a busy/idle loop and consumed about 6 percent of the CPU while reporting less than 0.5 percent. Overall, this period sustained a real usage rate of 8.8 percent with only 1.1 percent reported via sampling.
|
Figure 5. Discrepancy (error) in CPU usage reported versus actual CPU usage measured over time for 167-MHz Ultra 1/170 (CPU useage is denoted by the line, error is denoted by the dots.) |
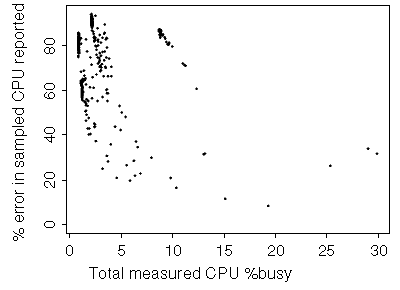
When we look at the error on this system as a function of the measured usage, it shows several separate clusters of data, each of which could have its own fitted curve. No overall curve could be fitted to this data.
|
Figure 6. Discrepancy (error) of reported CPU usage versus actual CPU usage measured for 167-MHz Ultra 1/170 |
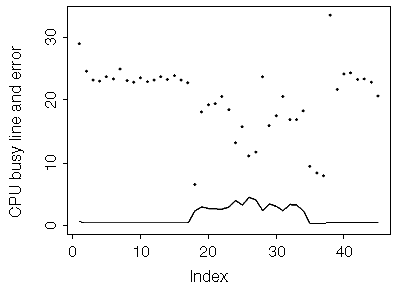
Finally, on a much slower CPU -- the 85-MHz microSPARC -- the error levels are smaller, as we would expect.
|
Figure 7. Discrepancy (error) of reported CPU usage versus actual CPU usage measured over time for 85-MHz microSPARC (CPU useage is denoted by the line, error is denoted by the dots.) |
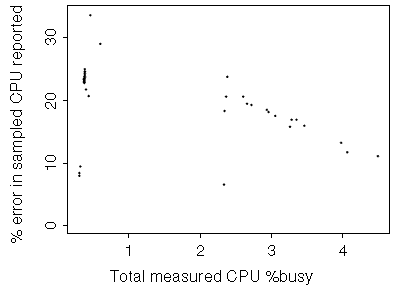
The measured load level was on the low side all the time, and the results are too scattered to obtain a good fit.
|
Figure 8. Discepancy (error) of sampled CPU usage reported versus actual CPU usage measured for 85-MHz microSPARC |
Wrap up
These errors are significant. They may explain why you never seem to
be able to scale a workload up as far as you'd expect to from an
apparently low-usage level to a high one.
This problem gets worse on faster CPUs and as more CPUs are added to a system. In the future, CPU measurement will be less and less accurate. This problem isn't specific to Solaris 2. It's a generic Unix problem that probably affects other operating systems as well. Not many operating systems support high-resolution measured CPU usage data.
I'm interested to see what the data looks like for more varieties of workload and will be doing some more tests. If you don't mind collecting data and sending it to me, I'd appreciate the input. To get systemwide data, cpuchk.se needs to be run on Solaris 2.6 as root -- so take care, and avoid production systems.
There is not a lot you can do to solve this problem. The sampled data collection is inaccurate, but it is very low overhead. Performance tools that look at per-process CPU usage should use microstate enabled data. Even on a single system there is no simple calibration that can be applied to correct the errors, as they vary depending upon the workload.
You can download a tar file from the regular SE3.0 download page
that contains updated workload and process classes, pea.se and
pw.se, cpuchk.se, a new version of the proc.se header file, and the
pw.sh script. When you untar it as root, it automatically puts the
SE files in the /opt/RICHPse directory, and it puts pw.sh in your
current directory.
![]()
|
|
Resources
About the author
Adrian Cockcroft joined Sun Microsystems in 1988,
and currently works as a performance specialist for the Server Division
of SMCC. He wrote
Sun Performance and Tuning: SPARC and Solaris,
published by SunSoft Press
PTR Prentice Hall.
Reach Adrian at adrian.cockcroft@sunworld.com.
If you have technical problems with this magazine, contact webmaster@sunworld.com
URL: http://www.sunworld.com/swol-06-1998/swol-06-perf.html
Last modified: