|
|
Learn what is really bogging down your networkNetwork statistics often reveal unexpected culprits slowing data transfers. Finding these gremlins can eliminate finger pointing between your various consultants and increase system performance. Here's how proper testing solved one company's network troubles |
Finger pointing is commonplace when multiple consultants run different parts of a systems installation and things go awry. When one set of SAP consultants and another set of network consultants tried to find out why a pharmaceutical company's network was slowing, all the elements were there for a potential clash of titans. Here's how one company overcame the potential obstacle and found the real problem facing the client. (2,000 words)
|
Mail this article to a friend |
We have spent the better part of our adult lives designing and building high-speed networks that allow "state-of-the-art" client/server applications to run efficiently. If you have had similar experiences, we are sure you have also shared the following experience.
Once an application has been detailed and estimates have been made for the flow of the application across the network, the decision day comes. The network is ready, the servers and clients are ready, and the application developers load the magical elixir on the appropriate machines. The okay is given, and the application is tested in a particular building or domain. More often than not, the application (which is generally nine to eighteen months late) runs slowly. Why?
Very simple, according to the developers -- the stupid network is slow!
Recently, we had the opportunity to tweak a network and design the network and systems management architecture for a Fortune 100 pharmaceutical company -- we'll call it Firm A. The company decided that the SAP R/3 order entry module would improve its operations and generate larger profits.
A consulting firm (we will call it Firm B) was tasked with installing, customizing, and testing the SAP R/3 application. They loaded the software on several servers and identified the need to verify whether the existing network could handle the new SAP R/3 traffic. A comprehensive test suite was designed to simulate real system transactions at an accelerated rate to simulate distributed loads generated by the user community.
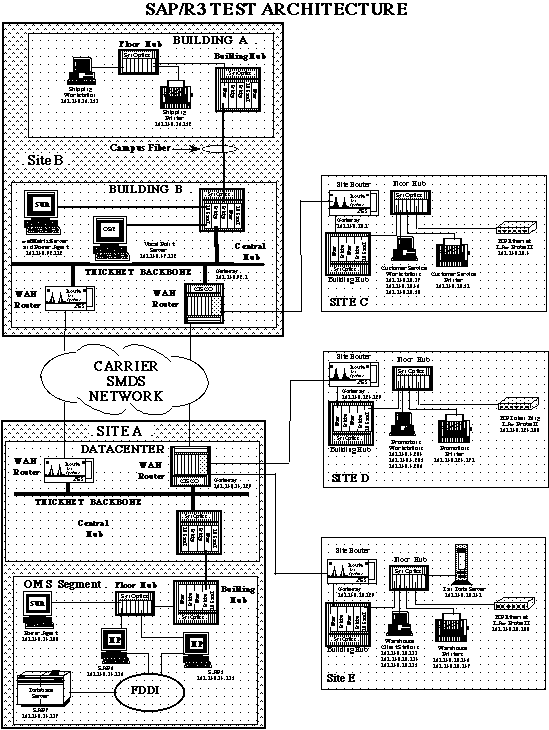
Although performance monitoring tools existed within SAP R/3, there was no way to separate network from processor delay. In the client/server world, end-to-end response is a function of both network and processor delay (see Figure 1). Our firm, The Netplex Group, was asked to devise a test method to measure one-way response time of application specific packets between each of SAP R/3 LAN segments.
The measurements had to be taken after the initiating process had been completed and just before the receiving process started (i.e., "Ping was unacceptable" because Firm B wanted to approximate the actual SAP R/3 frame, and the network test could not touch the processor). The test environment could not impact the monitored SAP R/3 systems. Firm A wanted users to receive good and predictable response to the application, and they wanted to avoid finger pointing between Firm B and our company.

|
|
|
|
|
How we did it
We used a distributed test architecture to derive the response time
measurements for the client/server-based SAP R/3 application. A
combination of hardware and software agents (data collectors) were
installed at the different sites and synchronized to the management
station running the remote monitoring (RMON) application in Site "B." A
unique set of data protocol filters were developed and deployed on each
of the collection agents. The intent of the filters was to facilitate
the capture of a representative sample of the data transactions for the
specific SAP R/3 application modules included in this test.
The collected data was then exported to a database to provide time-stamp correlation and to facilitate the generation of tabular results included in this report. The primary function of the distributed network test set was to ensure the capture time-stamped network traffic at both the client and server side of the communication path in order to identify network response time as a separate entity.
Here's how we set up the testing for this application:

Transactions types and capture filters
The objective of the capture filter was to allow for the collection of
a manageable amount of data samples for each of the SAP transaction
types. The filters allowed for a subset of the SAP R/3 transaction
packets to be isolated from the normal production traffic. Once
isolated, the packets were captured and time stamped at the sending and
receiving ends. The packet filters were as follows (See sidebar "How the testing was done" for
the technical details).
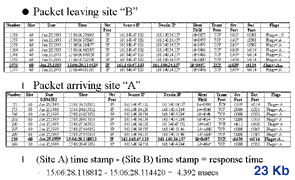
A sample of the correlated response time data was as follows (with the bold type indicating the packet sequence captured leaving Site B and then arriving at Site A).
Summary of test results
The response time tests showed the following results:
collection period. The variations in the response time can be attributed to the higher segment loads seen at the end of the test period.
Response times were generally low, with exceptions noted due to the higher utilization of the segments. Response time measurement and especially utilization can be factored into overall capacity planning for both networks and systems.
Utilization tests showed these results:
As a rule of thumb, there is cause for further analysis or network modifications if the sustained (rather than average) utilization exceeds 40 percent.
Knowing what to test does the trick
Network utilization was monitored on each of the SAP network segments in
order to quantify the added load of the new application. Utilization
on SAP R/3 LAN segments at Sites C, D, and E were well within normal
operating levels throughout the test and showed no adverse affects
from the added SAP R/3 application load. Sites B and A backbone segment
utilization averaged in the low to mid 20 percent range with many extended
periods levels at 40 percent, which is considered the upper level of
the operational Ethernet range for a large environment. These levels
are in line with the baseline values recorded prior to the test.
Although the utilization levels are normally high, the SAP test had no
adverse affects on either segment.
The consistent loading of the SAP network segments allowed the response time measurements to be extrapolated to encompass the entire test period. The response time data collected during this test confirmed that the existing network infrastructure added insignificant delay to the SAP transactions. The system testers reported that overall system response time was good throughout the test period. Although network latency is a function of many variables, the general network response time was typically small enough to be imperceptible from the user's perspective. This allowed Firm B's implementation team to focus on application-specific areas to resolve response time issues during the SAP implementation -- and all finger pointing at Firm A's network was avoided.
The above example demonstrates the value of collecting and analyzing performance statistics over a period of time. Network management is a process, and one of the first steps is historical analysis of your network. It is interesting to know how your network behaves on average, but it is more important to know how your network performs at a given time of the day, month, or year.
Knowledge of the operational characteristics of your networks allows your staff to separate abnormal events from normal events. It also allows trending information to be stored and provides for proactive (adding another private Switched Ethernet segment to a power user), rather than reactive (shutting down a port), management capabilities.
There are many fine RMON compatible software vendors (Frontier, Technically Elite, etc.) in the marketplace, but we decided to utilize Hewlett-Packard's NetMetrix and especially the Distributed Network Analysis (DNA) (formerly Internetwork Response Manager) component. The latter provides an example of the value of integrated management solutions. That is, the Distributed Network Analysis utilizes HP OpenView Node Manager as a timing and synchronization clock.
While other RMON vendors have excellent functionality, they have not
implemented the distributed timing mechanism with HP OpenView. In
addition, DNA provides the foundation for integrating both network and
systems performance metrics for the ultimate goal of operational
managers: end-to-end service level management.
![]()
|
|
If you have technical problems with this magazine, contact webmaster@sunworld.com
URL: http://www.sunworld.com/swol-02-1997/swol-02-realworld.html
Last modified:
IP addresses and the FTP control socket (21) filters were used as filters to capture bulk file transfers between SAP 6 and the TanData server. The Site E hardware probe and Site A software probe were programmed to capture this data.
IP addresses and the TCP Sync bit were used as filters for transaction between the IVR Vocal Point server to SAP 7 server. This transaction type did not open standard SAP sockets but did initiate a new TCP connection for each call. The Site B software probe and Site A software probe were programmed to capture this data.
IP addresses, blocks of IP identification numbers, and 3200 socket filters were used to capture promotion transactions generated from the three workstations at Site D to the SAP 6 server. The Site D hardware probe and Site A software probe were programmed to capture this data. SAP application functions that utilize the socket 3200 establish a connection and leave the connection open throughout the day.
IP addresses, blocks of IP identification numbers, and 3200 socket filters were used to capture customer service transactions generated from the three workstations at Site C to the SAP 5 server. The Site C hardware probe and Site A software probe were programmed to capture this data. SAP application functions that utilize the socket 3200 establish a connection and leave the connection open throughout the day.
IP addresses, blocks of IP identification numbers, and 3200 socket filters were used to capture warehouse transactions generated from the three workstations at Site E to the SAP 5 server. The Site E hardware probe and Site A software probe were programmed to capture this data. SAP application functions that utilize the socket 3200 establish a connection and leave the connection open throughout the day.
IP addresses, blocks of IP identification numbers, and 3200 socket filters were used to capture shipping transactions generated from the one workstation at Site B to the SAP 6 server. The Site B software probe and Site A software probe were programmed to capture this data. SAP application functions that utilize the socket 3200 establish a connection and leave the connection open throughout the day.
Note: Captures were limited to packet headers to conserve probe buffers (memory).
About the author
Frank Henderson is chief technology officer at The NetPlex Group. His expertise is in designing and installing networks and reengineering help desks, and in ORB, distributed databases, and network management.
Reach Frank at frank.henderson@sunworld.com.