Dissecting proxy Web cache performance
We show you how caching proxy Web servers can relieve swamped networks and control Web traffic routing
July 1997
|
|
Dissecting proxy Web cache performanceWe show you how caching proxy Web servers can relieve swamped networks and control Web traffic routing |
July 1997 |
A caching Web server acts as an invisible intermediary between a client browser and the servers that provide content. It is used to cut down on overall network traffic and to provide administrative control over Web traffic routing. Performance requirements are quite different from a regular Web server. After discussing the issues we'll look at several extra metrics that need to be collected and analyzed. (3,300 words)
|
Mail this article to a friend |
Q: Our proxy Web servers seem to be a lot busier than our other servers, and users are complaining that they are slow. Why are they so busy, and what's likely to be making them slow?
A: There are two different classes of caching proxy Web servers. They are used in small- to medium-sized installations to implement companywide intranets. They are also used in very large installations to provide country-level caching and filtering on the Internet. In both cases the primary goal is to reduce wide area Web traffic, by caching commonly used data closer to the end users. In common usage for small to medium intranet sites is the Netscape Proxy Cache Version 2.5. Sun uses it to provide Web service infrastructure for our internal wide area network, and I'll concentrate on it in this column. Medium to large scale sites need to use a clustered proxy system such as Squid or the Harvest cache. I'll highlight the advantages of the clustered proxy, but I have more direct experience with Netscape 2.5 to share at the moment.
Earlier this year I wrote a series of columns on caching, and we should start by remembering the caching principle of temporal and spacial locality. In the case of a Web cache, cacheable objects are always separate and are always read in their entirety with no pre-fetching. The only spacial locality you get is that several requests may go to the same server, and you may get a benefit from HTTP keepalive (properly known as HTTP 1.1 persistent connections). Since the client browser always talks to the same cache, keepalive is quite beneficial. The Web cache mostly works using temporal locality. If cached items are read more than once in a reasonably short time interval the cache will work well. If every user reads completely different pages the cache will just get in the way. If the same users re-read the same pages their browser is going to cache them on the client, so the server cache won't get used effectively.
Web content is not all cacheable. Some of the busiest traffic is dynamic in nature and caching it would prevent the browser from seeing an update.
|
|
|
|
|
So how well do caches work in practice?
The intranet-based caches that I have looked at have a cache hit
rate of about 30 to 50 percent, with only 50 to 60 percent of the
data being cacheable. That does not take into account the size of
each access, just the total number of accesses. Each cache
transaction takes a while to complete and adds significant latency
to the connection time. In other words, the cache slows down users
significantly, and only a small proportion of the data read is
supplied from the cache.
Direct Web Service |
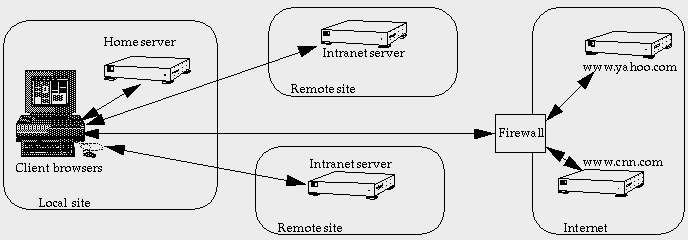
There is also a "funneling" effect as all the users go through the cache regardless of their final destination. This can increase network load at a local level, since accesses to local Web servers will normally go via the cache, causing two trips over the local net, rather than one. The other big problem is that the cache is a single point of failure with every user depending upon it. I've drawn some diagrams to show the difference. You need to remember that there are a large number of client systems at several sites. I've only shown one proxy cache at a remote site. The subject of how many caches and where to site them will be discussed later.
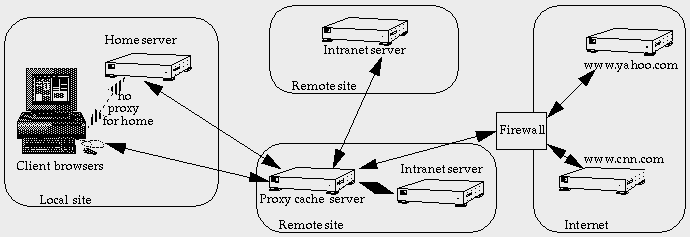
Indirect Web Service |
So why use a cache?
The reduction in wide area network traffic from a 30 to 50 percent
hit rate is worth having, especially since wide area links are
expensive and may be saturated at peak times.
The real reason to set up a proxy cache intranet infrastructure is the administrative control that you get. Security is a big problem, and one approach is to set up the firewall gateways to the Internet so that they will only route Web traffic to and from the proxy caches. The proxy caches can make intelligent routing decisions. For example Sun has connections to the Internet in Europe and the U.S. If a user in Europe accesses an Internet Web site in Europe it is routed via the local connection. When an access is made to a site in the U.S. a choice can be made. The route could go to the U.S. over Sun's private network to the U.S.-based gateway, or it could go directly to the Internet in Europe and find its own way to the U.S. The second option reduces the load on expensive private transatlantic links, but the first option can be used as a fallback if the European connection goes down for any reason.
Use peer pressure to keep your intranet productive
Restricted routing also forces every user who wishes to get out
to the Internet to do so via a proxy cache. The cache can make
routing and filtering decisions and logs every access with the URL
and the client IP address (which is usually sufficient to identify
the user). If the corporate policy is "Internet access is
provided for business use during business hours only" then employees
who clog up the networks with non-business traffic can be
identified. It is probably sufficient to make it known to the
employees that their activity is being logged, and they can be
traced. Perhaps you should post an analysis of the most visited
sites during working hours for everyone to look at? Filtering can be
added to deny access to popular but unwelcome sites.
The point I am making is that you have a limited amount of expensive wide area network capacity. There is a strong tendency for users to consume all the capacity that you provide. Using gentle peer pressure to keep the usage productive seems a reasonable thing to do and can radically improve the performance of your network for real business use.
Client Web browser configuration
Netscape Navigator has several network setup options. One option is
to read its configuration from a given URL. This allows centralized
setup of the binding to a proxy cache, but users can reconfigure
their browsers themselves. One extra option is a list of sites that
are accessed directly without using the proxy cache. If there are
Web servers that are "closer" to the end user than the proxy cache,
then it is much better to go to them directly. This may include the
user's home page server. In the indirect Web service diagram this is
shown as a dashed arrow marked "no proxy for home."
The browser also has several megabytes of local cache, so each individual user caches their own frequently visited sites. The shared proxy cache only really benefits groups of users who all visit the same sites.
Clustered proxy cache architectures
The Netscape proxy cache is an extension of a conventional Web
server. It is used singly, and while it can be used in a hierarchy
of caches, there is no optimization between the caches. The
alternative is a clustered cache. The basic research work has
resulted in two common implementations. The Harvest Cache was the
original development, and it is now a commercial product. The Squid
cache is a spin-off that is freely available. Squid is in use at the
biggest cache installations that I'm aware of, caching traffic at
country level for very large Internet service providers.
Clustered caches use an inter-cache protocol (ICP) to talk amongst themselves and form an explicit hierarchy of siblings and parents. If the load would overwhelm a single machine, multiple systems are configured as siblings. They each store data in their cache, but also use the ICP to search their siblings' caches. The net result is that the effective cache size is that of all the siblings and parents combined, the hit rate is improved, and it doesn't matter which sibling a client visits.
Sibling caches can be pared up as needed to provide highly available caches using the well-known techniques of DNS round robin and IP address failover. The parent-child relationships form a more efficient hierarchy as the ICP-based connections are much more efficient than individual HTTP transfers. The connections are permanent, and transfers have lower latency. In the diagram below, the home server now also doubles as the first level in the hierarchy. It caches from some sites directly and uses a larger parent cache for others and for Internet connections. The parent handles traffic from a large number of clients at many sites. It uses dual systems running as siblings for high availability and to split the load. It also uses ICP to talk to an up-rated firewall that acts as a first-level cache for the Internet. Because ICP-based traffic has much lower latency than HTTP traffic more levels of the cache hierarchy can be used without slowing down the user. There is also a benefit when making routing decisions, as ICP carries the full domain name of the host with it and saves a lot of DNS lookups that often occur in an HTTP based hierarchy.
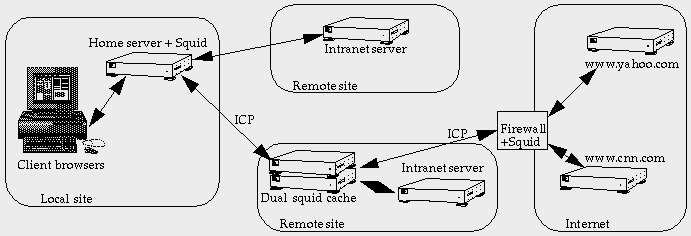
Clustered Web Cache Server |
Which one is best?
The clustered approach is a little more complex to set up and
maintain. It also requires coordination between administrators on
widely separated sites. The simpler HTTP-based caches are all
independent entities, and that may be easier to administer. As wide
area network speeds increase, and individual server performance also
increases, there is less need to build a hierarchy. It's
horses-for-courses, and you can start with one, then change the
software to try the other approach to see which works best for you.
Configuring and monitoring the Netscape 2.5 proxy cache
I've been collecting some data and monitoring load levels on the
Netscape 2.5 proxy cache that serves most of Sun U.K.'s 1000 or so
employees. It's situated at the largest site, so some users have
LAN-based access speeds. There are several other sites in the U.K.
though that recently upgraded to 500-kilobit (Kbit) frame relay
links to the central site. There are also a number of users
connected over 128-Kbit ISDN and 28.8-Kbit dial-up connections.
The access log contains the same data as a normal Web server log, but there are several additional values being logged. Netscape supports two extended formats and also allows a custom format to be specified. The format in use at Sun is a fairly complete custom log format. The format string looks like this:
%Ses->client.ip% - %Req->vars.pauth-user% [%SYSDATE%] "%Req->reqpb.proxy-request%"
%Req->srvhdrs.status% %Req->vars.p2c-cl% %Req->vars.remote-status% %Req->vars.r2p-cl%
%Req->headers.content-length% %Req->vars.p2r-cl% %Req->vars.c2p-hl% %Req->vars.p2c-hl%
%Req->vars.p2r-hl% %Req->vars.r2p-hl% %Req->vars.xfer-time% %Req->vars.actual-route%
%Req->vars.cli-status% %Req->vars.svr-status% %Req->vars.cch-status%
[%Req->vars.xfer-time-total%  %Req->vars.xfer-time-dns%  %Req->vars.xfer-time-iwait%
%Req->vars.xfer-time-fwait%] %Req->srvhdrs.clf-status%
The breakdown is shown in the table below with examples:
| Format String Entry | Meaning | Example values |
| 1. Ses->client.ip | client hostname | 129.156.123.32 |
| 2. - | - | - |
| 3. Req->vars.pauth-user | authentication | - |
| 4. [SYSDATE] | system date | [19/Jun/1997:13:21:12 |
| 5. | timezone | +0100] |
| 6. "Req->reqpb.proxy-request" | request | "GET |
| 7. | URL | http://host.domain/page.html |
| 8. | protocol | HTTP/1.0" |
| 9. Req->srvhdrs.status | status to client | 200 |
| 10. Req->vars.p2c-cl | length to client | 4177 (bytes) |
| 11. Req->vars.remote-status | status from server | 200 |
| 12. Req->vars.r2p-cl | length from server | 4177 (bytes) |
| 13. Req->headers.content-length |
|
- |
| 14. Req->vars.p2r-cl |
|
- |
| 15. Req->vars.c2p-hl | client header req | 339 (bytes) |
| 16. Req->vars.p2c-hl | proxy header resp | 271 (bytes) |
| 17. Req->vars.p2r-hl | proxy header req | 379 (bytes) |
| 18. Req->vars.r2p-hl | server header resp | 271 (bytes) |
| 19. Req->vars.xfer-time | transfer total secs | 5 |
| 20. Req->vars.actual-route | route | - DIRECT PROXY(host:port) SOCKS |
| 21. Req->vars.cli-status | client finish status | - = not started, FIN = OK INTR = interrupted/terminated |
| 22. Req->vars.svr-status | server finish status | - FIN INTR TIMEOUT |
| 23. Req->vars.cch-status | cache finish status | - WRITTEN REFRESHED ERROR NO-CHECK UP-TO-DATE HOST-NOT-AVAILABLE CL-MISMATCH DO-NOT-CACHE NON-CACHEABLE |
| 24. Req->vars.xfer-time-total | total transfer secs | [4.988 |
| 25. Req->vars.xfer-time-dns | dns lookup | 0.000 |
| 26. Req->vars.xfer-time-iwait | initial wait | 4.802 |
| 27. Req->vars.xfer-time-fwait | full wait | 4.980] |
| 28. Req->srvhdrs.clf-status | yet another status | 200 |
The interesting data to extract is the mixture of possible cache outcomes that determines whether it is a cache hit or not, the routing information, and the transfer time. I extended a version of my percollator.se script to parse this log format and summarize the data. This will be included in the next version of the SE toolkit, but it doesn't work with the current version 2.5.0.2 of SE. As an aside, we have had to wait for Solaris 2.6 to finalize. Some late changes to the metrics in 2.6 need to be incorporated into SE, and that work hasn't been done yet.
I extract field number 20, the route. I count all the entries that go to PROXY or SOCKS and report the percentage that are indirect. This is the percentage that gets routed to the Internet, rather than being DIRECT references to other servers in the corporate intranet or incomplete transfers marked with a "-".
I extract field number 23, the cache finish status, and divide the operations into four categories. The NO-CHECK and UP-TO-DATE states are cache hits. The WRITTEN, REFRESHED, and CL-MISMATCH states are misses that cause cache writes. The DO-NOT-CACHE and NON-CACHEABLE states are uncacheable, and anything else is an error or incomplete transfer. I work out the percentages for the first three and record them.
I extract field number 24, the total transfer time. This is a higher resolution version of field 19, with millisecond rather than second resolution. I work out the average transfer time, but because the transfer size varies from zero to several megabytes I also work out the average transfer time for each of the size ranges that I record the mix for. The mix in my latest percollator.se code is based on the SPECWeb96 size boundaries of up to 1 kilobyte (KB), 1 KB up to 10 KB, 10 KB up to 100 KB, 100 KB up to 1 megabyte (MB) and over 1 MB. I end up with the percentage of ops and the average transfer time in each size range.
Observed results in practice
On a fairly quiet weekday 280,000 accesses went via this cache. 56
percent of the accesses went out to the Internet. The cache
breakdown was that 34 percent of the accesses hit in the cache, 16
percent missed and caused a cache write, 49 percent of the accesses
were not cacheable, and one percent ended in some kind of error.
Looking at a week's worth of data the indirect and cache hit rates
vary by five to 10 percent from day to day.
The transfer time average is about 2.3 seconds. The problem with this figure is that it includes a small number of very large or very slow transfers in the average. The average for transfers up to 1 KB was 1.8 seconds, for 1 to 10 KB it was 2.5 seconds, for 10 to 100 KB it was 6 seconds, for 100 KB to 1 MB it was 40 seconds, and for over 1 MB it was 188 seconds. Within each of these size bands there are connections taking place over everything from 100-megabit Ethernet to 28.8-Kbit modems, so it's hard to tell how much impact the cache is having.
Transfer time versus size distribution
I also took 10,000 accesses and plotted size against transfer time
using log-log axes, after removing all zero content length and zero
time transfers. The result shows that transfer time is not very
dependent upon size until the size gets into the 10 to 100 KB
region, as you can see in the plot below.
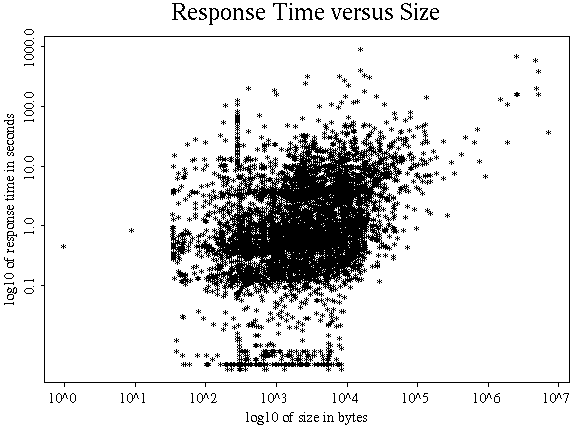
Log-log plot of response time versus size |
This plot shows bands of transfer times that depend upon the user location. A lot of users are locally connected, but others are operating over slower networks. The transfer time includes the time spent waiting for the remote server to respond, so it does not represent the extra time imposed by the cache. It actually gives a reasonable summary of the response time that users are getting on their browsers. This is useful because rather than attempting to measure the response time at an individual user, it can be collected at a central point.
In this case the server is not responding as well as it might. Its disks are a bit too busy at times, and HTTP keepalive (persistent connections) is temporarily disabled because of problems interacting with the internet gateway proxy. You should make a plot like this that summarizes a day or a week's data, and look for changes in the plot over time. The data can also be viewed as a 3D probability density histogram as shown in the next plot. This plot shows that the most probable response is at about 0.5 seconds and 1 KB. Remember that the average response time is 2.3 seconds on this data. It is clear that the average does not tell the whole story.
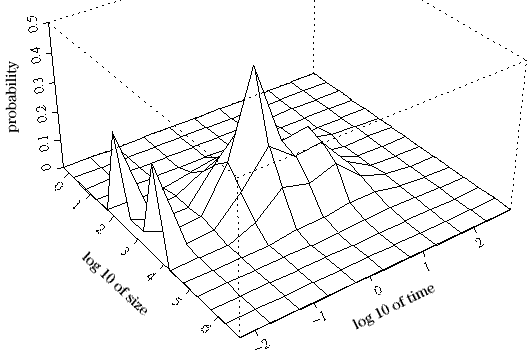
Perspective log-log plot of response time versus size distribution |
Hardware configuration issues
The biggest difference between a normal Web server and a proxy cache
is that there is a significant amount of writing cache contents to
disk. There is also a higher CPU load per operation, but the CPU is
rarely the bottleneck. The ideal configuration for a high-end proxy
cache would use a disk array with non-volatile RAM for fast writes.
More typical cache systems are smaller and use a handful of disks.
The effect of the NVRAM can be obtained using a transaction log, and
this should be on a dedicated disk if you want good performance.
I'll assume you have something like an Ultra 1 or Ultra 2 desktop server with two internal disks and an external multipack containing perhaps four disks (preferably on its own SCSI bus). You put all the operating system, swap space, and Web server code on the first internal disk and use Solstice DiskSuite 4.1 to stripe the four external disks together with a 128 KB interlace. To make writes go fast you take the second internal disk and make a single 100 MB partition on it into the transaction log, then combine the stripe and the log into a logging filesystem. The key is that the transaction log is small, and the disk heads are always moving over it in very short seeks doing sequential writes to the log. You should resist the temptation to make a mounted filesystem on the remainder of the log disk as the extra long seeks will hurt log performance. You need to take the attitude that the disk is 100 percent occupied from a service time performance point of view, even if it has spare storage and throughput capacity.
A single log can be used by several different filesystems, but it doesn't need to be any bigger than 100 MB. If you do share the log disk with other activity, it is still better than no log at all, but you will get much worse service times than are possible with a dedicated log disk. An iostat line from my local cache shows the situation where the log is sharing the system disk with everything else.
                                 extended disk statistics          cpu
disk      r/s  w/s   Kr/s   Kw/s wait actv  svc_t  %w  %b  us sy wt id
md0       6.1  5.3   34.8   14.2  0.0  0.4   35.5   0  15   4  4  8 83
md1       4.6  6.8   22.8   23.4  0.0  0.3   24.8   0  10
sd0       0.4  0.9    3.2   16.7  0.0  0.0   12.4   0   2
sd17      0.9  1.4    4.9    3.6  0.0  0.1   31.9   0   4
sd18      2.0  1.2   10.4    3.0  0.0  0.1   28.0   0   6
sd32      1.6  0.9   10.1    1.0  0.0  0.1   31.8   0   5
sd33      1.6  1.8    9.4    6.6  0.0  0.2   47.6   0   7
Solstice DiskSuite 4.1 shows its metadisks in iostat automatically. In this case sd0 is the system and log disk. sd17, sd18, sd32, and sd33 are the stripe disks. md0 is the stripe, and md1 is the log accelerated stripe that is actually mounted.
You can see that the system/log disk is averaging 12.4 milliseconds service time, and because most of the synchronous writes are logged this is the effective service time seen by proxy cache writes. The mounted logging filesystem md1 has a service time of 24.8 milliseconds for its reads and writes. The md0 stripe and the individual disks are higher than that. Overall this is OK, but the load level is low. As the system gets busier the combined system/log disk becomes a bottleneck with slow service times.
Wrap up
That's enough on Web caches for the moment. Next month I'll start
talking about some of the new features in Solaris 2.6. SunSoft has
now announced that 2.6 is due to ship in August, although SMCC has
not yet announced full details. There are two separate announcements
as SunSoft supplies several manufacturers with a generic product, and
SMCC packages it for sale on Sun's SPARC hardware.
We have been working on a new version of the SE toolkit for some
time. Some late changes in Solaris 2.6 mean that we have more to do,
and we must update documentation before we can release a new
version. To further complicate matters, Richard Pettit recently left
Sun to join Capital Technologies
(www.captech.com), a performance
tool vendor. He still intends to keep the SE toolkit going but is
rather busy at the moment. Please send comments on SE to the
se-feedback@chessie.eng.sun.com
alias, which still reaches both of us.
![]()
|
|
Resources
About the author
Adrian Cockcroft joined Sun in 1988, and currently works as a
performance specialist for the Server Division of SMCC. He wrote Sun Performance and Tuning: SPARC and Solaris, published by
SunSoft Press PTR
Prentice Hall.
Reach Adrian at adrian.cockcroft@sunworld.com.
|
|
|
|
If you have technical problems with this magazine, contact webmaster@sunworld.com
URL: http://www.sunworld.com/swol-07-1997/swol-07-perf.html
Last modified: