|
|
Disk tracing revisitedLet taz do the tough stuff for you |
Analyzing traces of disk activity can give you unique insight into the access patterns generated by an application. Unfortunately, it's very hard to do the analysis by hand, especially when high data rates are occurring. This month, Adrian introduces a simple tool that does the hard work for you. Plus: The SE 3.1 toolkit is now available in a test release. As Adrian explains, it has several updated features and runs only on Solaris 2.6 and Solaris 7. (2,000 words)
|
Mail this article to a friend |
![]() : In your October 1996 column and the second edition of your book there is a guide to using TNF probes to trace disk accesses. But when I try to use it there are too many I/Os in the trace, and it gets complex. Are there any tools that can help?
: In your October 1996 column and the second edition of your book there is a guide to using TNF probes to trace disk accesses. But when I try to use it there are too many I/Os in the trace, and it gets complex. Are there any tools that can help?
![]() : There are two tools that can be used with TNF trace data. The generic tool is called tnfview, and is available from the http://opcom.sun.ca Web site. I also persuaded Richard McDougall to write a simple disk trace-specific tool that has both command-line and graphical versions. In this column, I'll show you how the tool works and look at a few sample disk access patterns.
: There are two tools that can be used with TNF trace data. The generic tool is called tnfview, and is available from the http://opcom.sun.ca Web site. I also persuaded Richard McDougall to write a simple disk trace-specific tool that has both command-line and graphical versions. In this column, I'll show you how the tool works and look at a few sample disk access patterns.
Trace disk tool
This tool takes the TNF disk trace records and matches them up in pairs for the start and end of a disk transaction. It can see the time a request occurred and the block that was requested, so a direct trace of seek distance is available. The tool was built in a day or so and hasn't been developed since, so it's a bit crude and is missing a few features -- but it's far better than matching up TNF traces by hand! Richard McDougall wrote the code, and the initials, TD, reminded him of the Tasmanian Devil, so the tool is now called the taztool and the package you install is called RMCtaz.
The kernel has many TNF trace points; they can only be enabled if you have root permissions, so these tools must be run as root. These are "safe" tools to run as they are completely read-only, user mode tools that read from supported interfaces.
The two probe points used are sdstrategy, which is the entry point for scheduling a new disk read or write, and biodone, which signals completion. Allocation and lock down of memory to hold the I/O data is done between these two points, and the virtual memory system can be a source of delay, so the time you get is a little longer than the actual disk subsystem response time. The VM system delay is worse when the system is very short of memory and the request has to wait for the page scanner to reclaim memory before it can allocate a read buffer. Normally, the VM system delay is much shorter than the disk I/O delay itself, so it can be ignored.
The RMCtaz tools pick out activity to a single disk device at a time, discarding all the other TNF records. If you want to process more complex data for multiple devices, the tnfview tool can be used instead.
The RMCtaz package installs three files in /opt/RMCtaz. One is a README file, the other two are the text-based taz command and the Motif GUI-based taztool command.
Running the text-based taz command
This command needs to be told which disk device to access and monitors only one disk partition at a time. If you forget to become root before you run it, you'll get errors that look like this:
% /opt/RMCtaz/bin/taz /dev/rdsk/c0t3d0s1
prex: trouble attaching to the kernel: Permission denied

Taz: cannot open /dev/kmem: Permission denied
Open of TNF failed!
: Permission denied
Monitoring swap device activity on slice 1 of the system disk can be interesting. In this case the disk is a slow 2-gigabyte (GB), 2.5-inch device in a Tadpole laptop. You can find out the type of disk and device name using iostat -En on Solaris 2.6 or later releases.
% iostat -En

c0t3d0     Soft Errors: 0 Hard Errors: 0 Transport Errors: 0
Vendor: ADTX     Product: AXSITS2532U 011D Revision: A50G Serial No:  Copyright A
RPM: 3600 Heads: 8 Size: 2.17GB <2167144448 bytes>
Media Error: 0 Device Not Ready: 0 No Device: 0 Recoverable: 0
Illegal Request: 0 Predictive Failure Analysis: 0
The taz output shows you the block number offset in the device -- blocks are usually 512 bytes -- and shows you the time at which the command was issued, along with the "service time." (The "service time" is the time taken to process the entire request, so it should really be labeled response time.) The output also shows a seektime field that is always zero and the seek distance from the previous request.
# /opt/RMCtaz/bin/taz /dev/rdsk/c0t3d0s1
block=    106304, time=10000.532000, service=  0.000000, seektime=  0.000000, seek=         0
block=    117880, time=10034.967000, service=  0.000000, seektime=  0.000000, seek=     11576
block=     82544, time=10022.015500, service= 20.133000, seektime=  0.000000, seek=     35336
block=     75352, time=10055.815500, service= 24.319000, seektime=  0.000000, seek=      7192
block=     91112, time=10090.501000, service= 33.283000, seektime=  0.000000, seek=     15760
block=    123656, time=10072.045000, service= 36.499000, seektime=  0.000000, seek=     32544
block=     70448, time=10122.386000, service= 31.375000, seektime=  0.000000, seek=     53208
block=    100616, time=10106.979000, service= 34.202500, seektime=  0.000000, seek=     30168
block=    100608, time=10136.166000, service= 28.606500, seektime=  0.000000, seek=         8
block=    100096, time=10148.904000, service= 25.734500, seektime=  0.000000, seek=       512
block=    117872, time=10168.982500, service= 32.064500, seektime=  0.000000, seek=     17776
block=    100104, time=10172.493500, service= 22.803000, seektime=  0.000000, seek=     17768
block=    106040, time=10223.320000, service= 18.720500, seektime=  0.000000, seek=         0
block=    115128, time=10264.841000, service= 40.891500, seektime=  0.000000, seek=      9088
block=     71024, time=10247.966000, service= 42.511000, seektime=  0.000000, seek=     44104
block=    116736, time=10273.093000, service= 24.308000, seektime=  0.000000, seek=     45712
You can see from the above that accesses are fairly random, but it's quite hard to visualize head activity. With the addition of a GUI the trace data becomes more accessible.
|
|
|
|
|
Graphical disk trace display with taztool
Taztool looks at a whole disk rather than just one partition. The
disk to be viewed is chosen from a menu that is set up from a file
that must be created, before taztool is started, as /.disktooldevs.
This file contains a list of raw disk devices specifying slice 2 each time
to access the whole disk. This is explained with examples in the
README file.
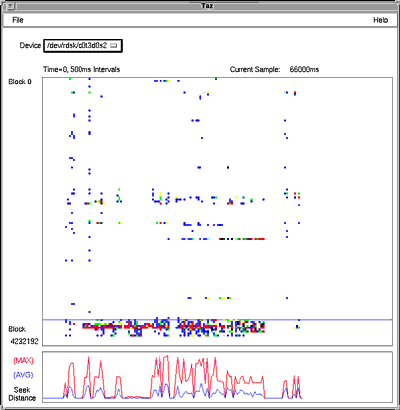
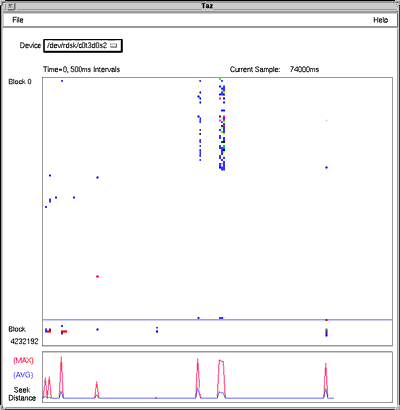
It shows the span of the disk on the vertical y-axis, and time on the horizontal x-axis, then makes a mark for each block that is accessed. Partition boundaries are shown as horizontal lines so that you can see how accesses are spread over the entire disk. Multiple marks in the same time interval are shown using color, with blue for a single access through orange to red for many accesses.
Below the "block access" display is a graph with two lines that show the average and minimum seek distance in the time interval.
The display updates every five seconds, and when the drawing area is full it is cleared and started again. Unfortunately, there is no way to adjust the time interval or to freeze the display. I used snapshot to do window grabs when the display was almost full. The results are shown below. These examples were taken on a 64-megabyte (MB) Tadpole SPARCbook with 2.5-inch, 2-GB disk running Solaris 2.6 with priority_paging enabled.
Paging in and out
A copy of Netscape Communicator had been used, then iconized and left for a while, and was largely paged out. The icon was opened and a lot of other data was paged out as the Netscape code and data was paged in. You can see one large filesystem covers most of the disk, a swap space fills most of the rest, and a small unused partition explains why there is no activity right at the bottom of the display. Most of the activity is to the swap space.
|
Finding files
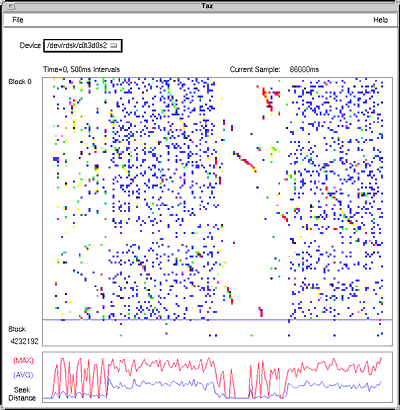
One of the best ways to make a disk rattle for a long time with random seek activity is to run a find command over the whole filesystem.
% find / -ls >/dev/null
The activity caused by the find is scattered all over the disk. There is very little swap space activity and a lot of seeking.
|
Creating a large file
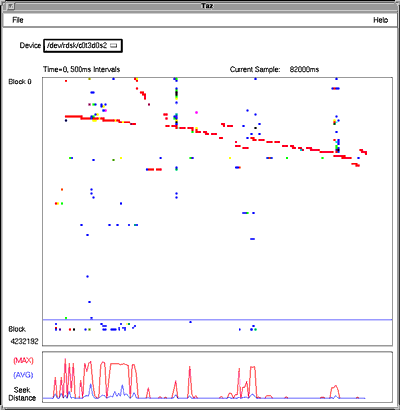
The main disk partition is about 1.7 GB and has about 400 MB available. A single 200-MB file was created using:
% mkfile 200M bigfile
The disk is fairly slow at sequential writes compared to the disks used on most desktop systems; however, you can see a clear solid block of writes moving down the disk over time. The block allocation isn't contiguous -- this is a UFS filesystem, and I'm quite amazed that it's this linear!
|
Reading a large file
After some unrelated activity intended to make sure the file wasn't
fully cached in RAM, it was read back using dd to do
fairly large block reads.
% dd if=bigfile of=/dev/null bs=128k
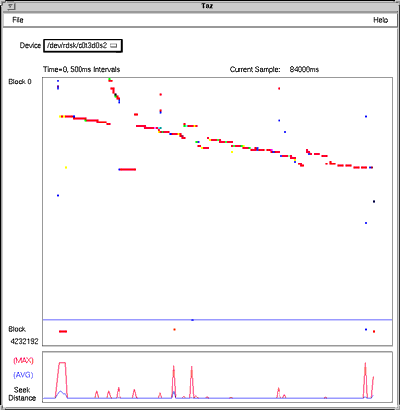
The display looks quite similar to the creation trace.
|
Deleting a large file
The file was deleted. This caused a dual burst of activity, which you
can see in the center of the display. The first burst is the
synchronous update of directory and indirect blocks that occurred as
the file was deleted. The second and longer burst happened 30
seconds later when fsflush came along and pushed out a lot of
asynchronous block updates. I'm not quite sure why this occurred.
|
Taztool wrap up
Taztool is fairly crude and inflexible, and Richard has been far too busy to work on extending it, but RMCtaz makes it a lot easier to see what's happening on disks. Whenever I try a new tool, I end up seeing things I don't initially understand, but trying diverse tools is an essential way to gain a deeper understanding of computer systems behavior.
You can get the RMCtaz1.1.tar.Z package (86 KB) at http://www.sun.com/sun-on-net/performance/RMCtaz1.1.tar.Z.
SE 3.1 beta release
We will shortly be updating the main SE Web page to include the option of downloading a beta release of an updated toolkit. It includes all the add-ons and fixes described in SunWorld throughout the last year. This beta release and the final release of SE 3.1 will support only Solaris 2.6 and Solaris 7, but it does add support for 64-bit Solaris 7 on SPARC to the regular SPARC and Intel 32-bit support. We no longer have any systems running Solaris 2.5 or 2.5.1 to test on, and we want to spend more time writing new code to add features, and less time testing old and less interesting systems. If you're still running Solaris 2.5.1, I'd encourage you to upgrade. There were a lot of interesting performance-related features introduced in Solaris 2.6. If feel you can't upgrade because yours is a "production machine," not to worry: you shouldn't really be running an unsupported experimental tool like SE on your production machine anyway.
Other new features of SE include an extended language that adds dynamically resizable arrays to make it easier to handle systems that undergo dynamic reconfiguration. Rich Pettit also changed SE so that it silently ignores any missing kernel data items that change their names or disappear. An extra compiletime option allows the old intolerant behavior for testing, just in case one of the things you were using went away and you want to see why you're now returning zero. This should spare us a lot of e-mail along the lines of: What does "drop vanished" mean? For the record, it means that the variable drop wasn't there when SE was expecting it; but because none of the example scripts ever used "drop" we don't really care. Rich also added a configuration file that parses the patches installed on the system into #define values that can be used to make conditional changes.
More details of the changes can be found on the Web site at http://www.sun.com/sun-on-net/performance/se3.
I hope you find these tools useful, and have a good 1999.
![]()
|
|
Resources
About the author
Adrian Cockcroft joined Sun Microsystems in 1988,
and currently works as a performance specialist for the Server Division
of Sun. He wrote Sun Performance and Tuning: SPARC and Solaris and Sun Performance and Tuning -- Java and the Internet, both published by Sun Microsystems Press Books.
Reach Adrian at adrian.cockcroft@sunworld.com.
If you have technical problems with this magazine, contact webmaster@sunworld.com
URL: http://www.sunworld.com/swol-01-1999/swol-01-perf.html
Last modified: